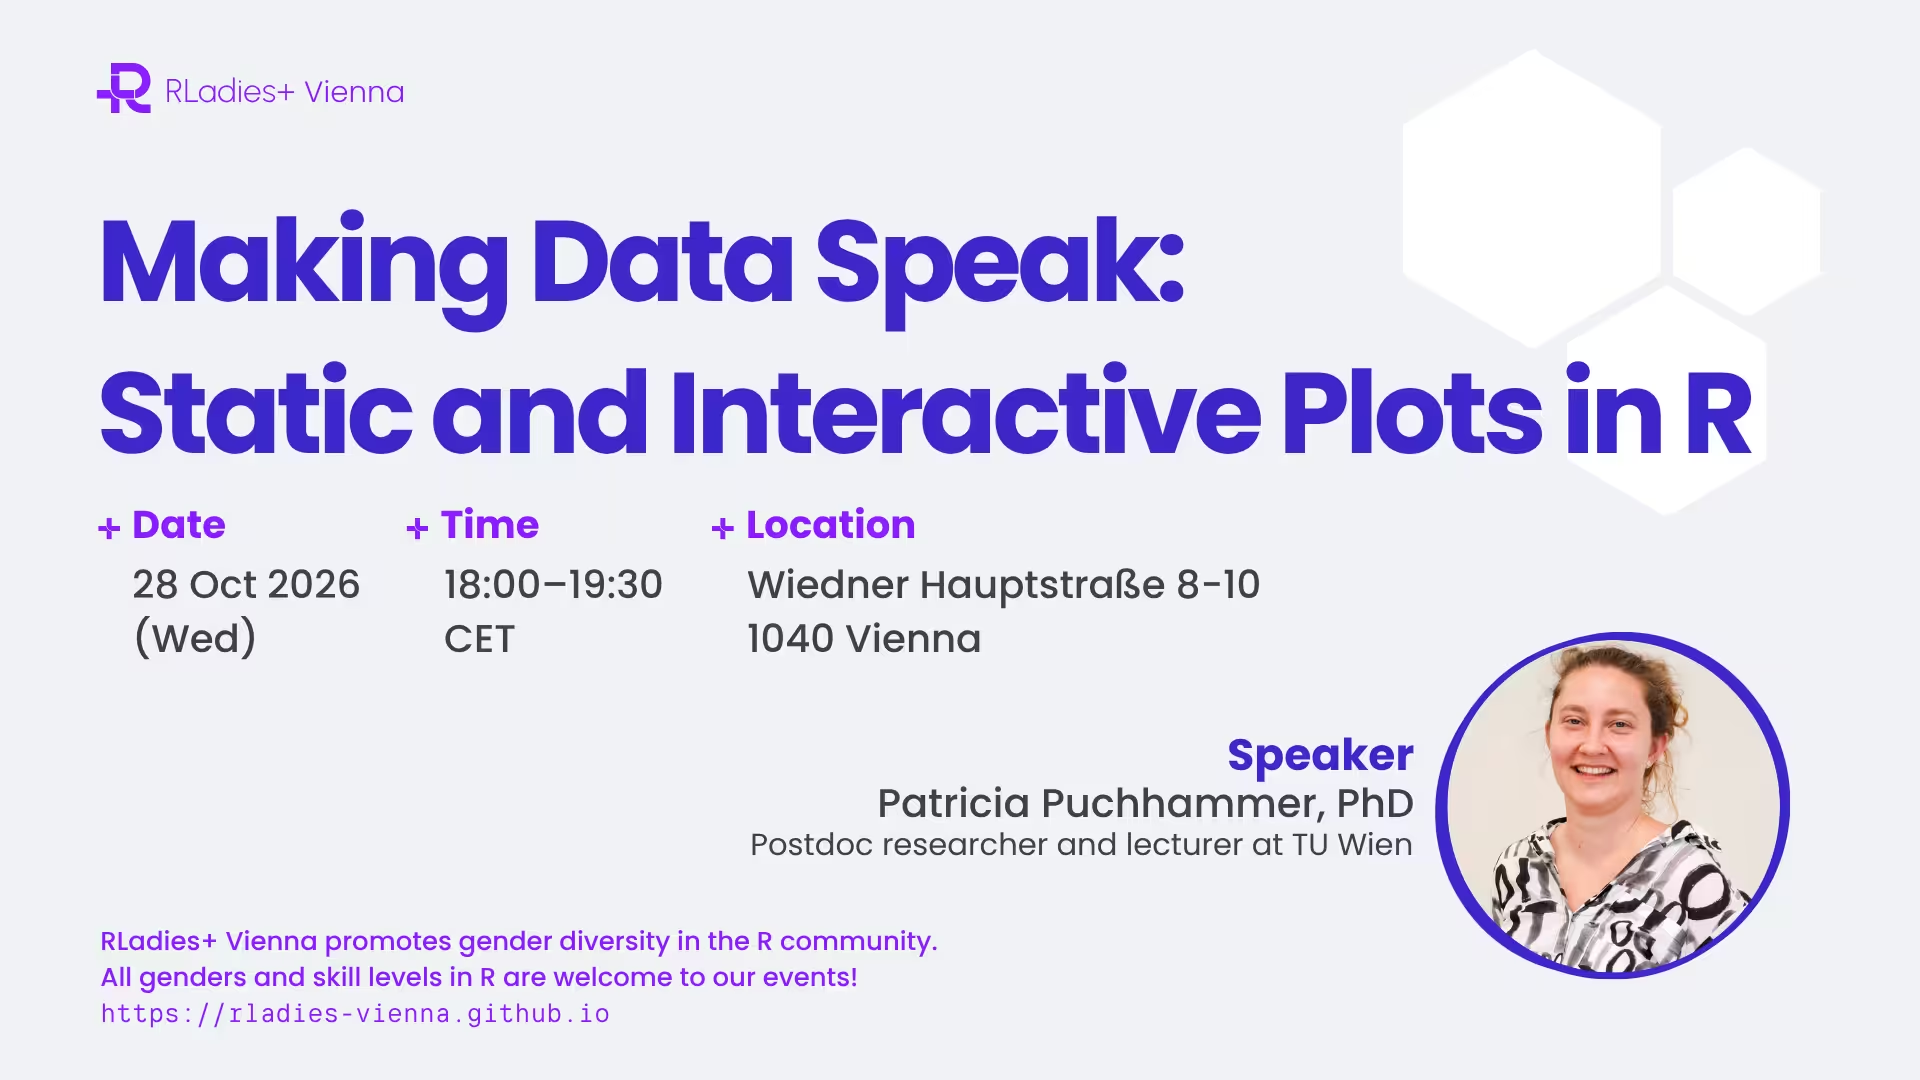
Date and Time
Wednesday, 28 October 2026
6:00 PM - 7:30 PM CET
Venue
Seminar Room DB yellow 09 / Sem.R. DB gelb 09
9th floor, yellow area
TU Wien Freihaus
Wiedner Hauptstraße 8-10, 1040 Vienna
About
Just like last year, we are welcoming the new academic year with a hands-on introduction to R, this time with a focus on data visualization. As we promote gender diversity and inclusion in the R community, all genders and skill levels in R are welcome!
Abstract
This is a hands-on introduction to data visualization in R for beginners. You’ll learn how to prepare your data for plotting, create clear and attractive graphics with the R package ggplot2, and add interactive features using the plotly package.
What to prepare
- Before the workshop, install R and RStudio on your laptop by following the 2-step guide at https://posit.co/download/rstudio-desktop/.
- On the workshop day, bring your own laptop to follow the workshop material closely and code along with us!
- (Optional) Bring a dataset you would like to work with
Speaker
Patricia Puchhammer
Patricia is a Postdoc researcher and lecturer in computational statistics at TU Wien. Throughout her studies in TU Wien, she has specialized in robust statistical methods for outlier detection. Prior to her doctoral work, she also worked as a data scientist at the Ludwig Boltzmann Institute for Lung Health, where she applied medical statistics.